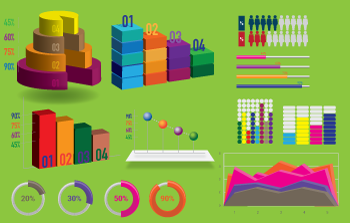
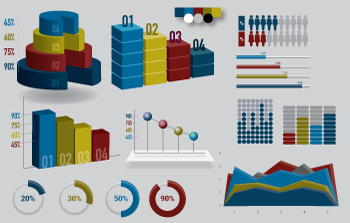
1.Data presenting
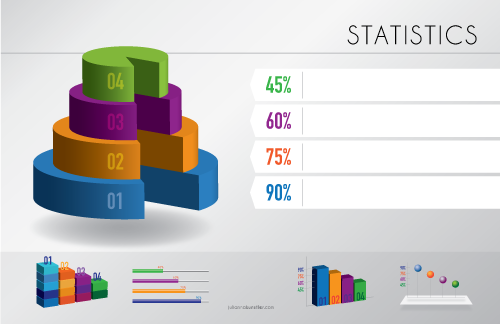
Use this layout if you are working with a lot of statistics and charts.
Statistical infographics focus on data and data visualization. The layout and visuals will help you to tell the story behind your data.
You can also connect the different points of your data by inserting a flowchart.
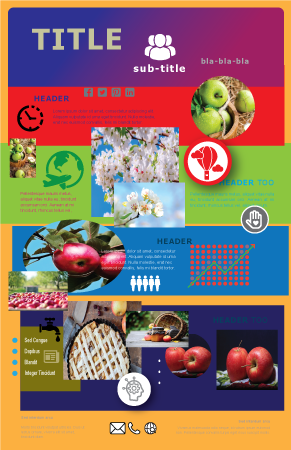
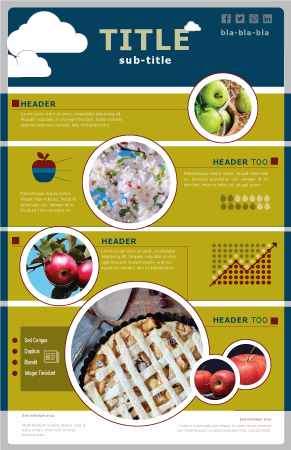
2. Information
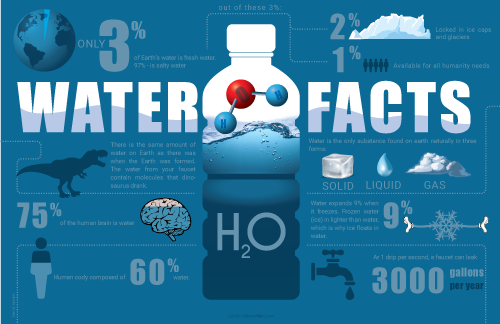
Communicate a specific concept or give an overview of a topic.
Works well with most types of data.
The layout should be practical - taking it easy to read. and comprehend the information
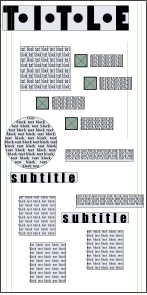
If your content has many subtopics to a main subject, this layout enables you to segregate them into clean chunks that are easy to consume.
Share information by organizing it into brief paragraphs, each section should have a descriptive title.
It helps to number each section, illustrate each section with an icon or an image.
3. Timeline
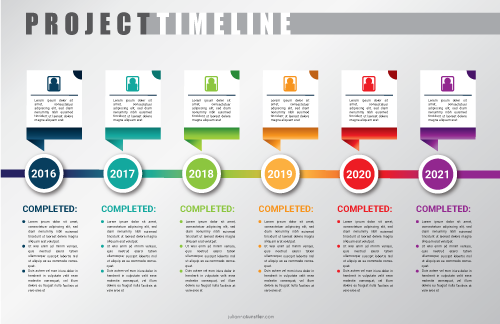
Visualize history, highlight important dates, or give an overview of events(a project timeline).
Use visual aids: lines, icons, photos, labels.
Use a main line (straight, curved, zig-zag, etc.) to connect different points in time.
4. Process
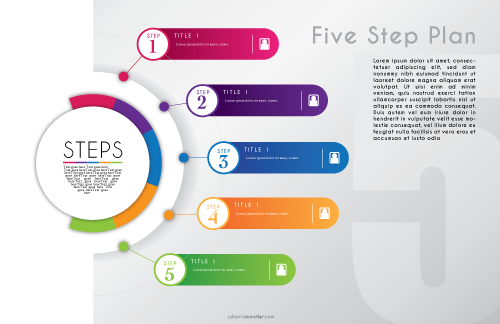
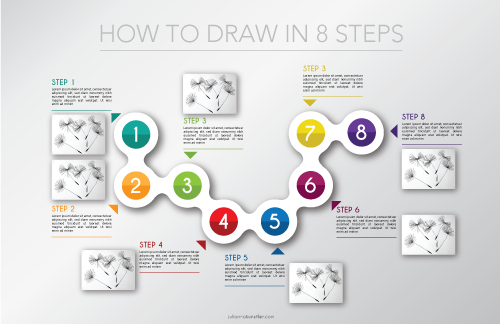
Use this layout to illustrate a summary or steps in a process.
Simplify, clarify, and visualize each step.
Numbering the steps makes it easy to follow.
Use an S-shape layout or a “road map” concept to fit many steps, use arrows, or other visual cues to point to the next step.
5. Comparison
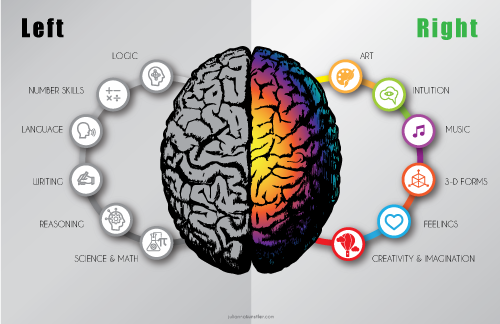
Comparison infographics visualize similar options for two or more things to make an informed decision by comparing options in an unbiased way. Divide layout in columns by using contrasting colors. Use brighter color for the option you want readers to pick.
6. Hierarchy
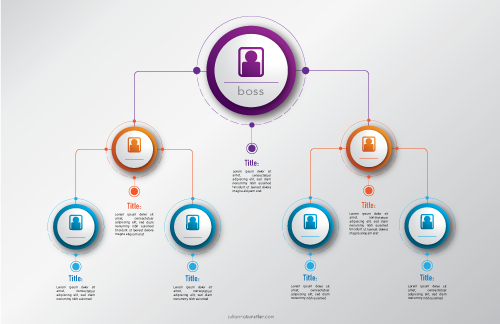
Use a pyramid or a flow chart layout to represent a variety of hierarchal information.
7. List
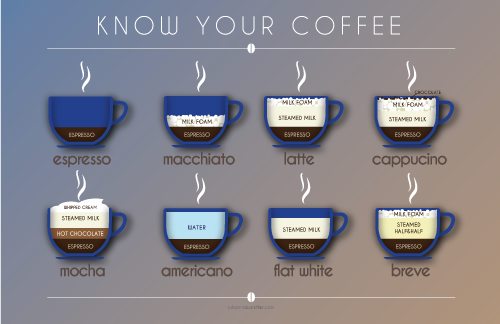
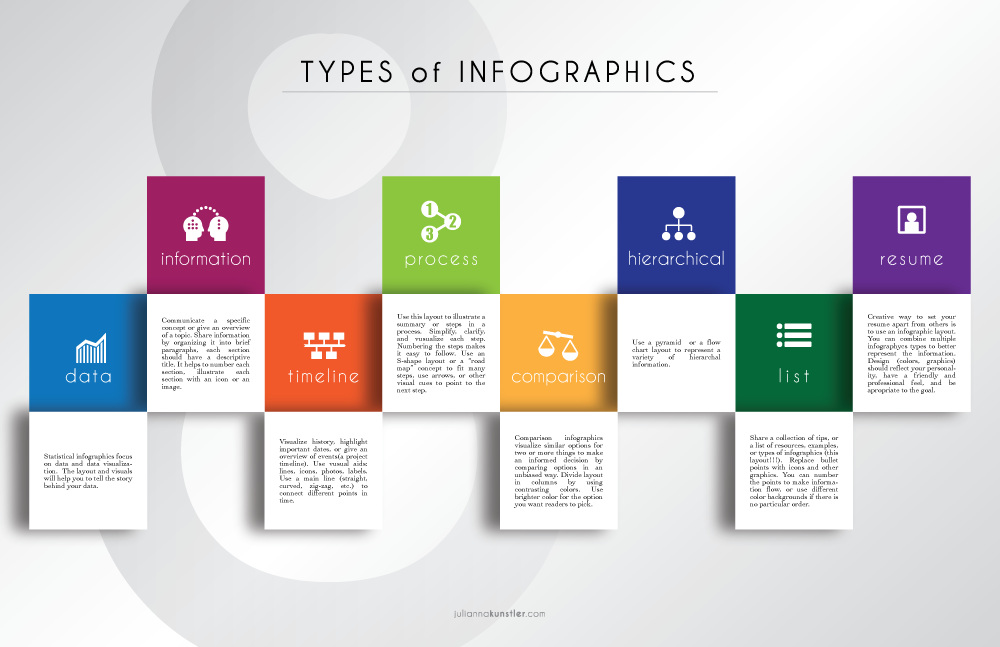
Share a collection of tips, or a list of resources, examples, or types of infographics.
Think about this layout as a set of equally important topics.
Add ons:
- you can replace bullet points with icons or other graphics
- you can number the points to make information flow,
- or use different color backgrounds if there is no particular order.
8. Resume
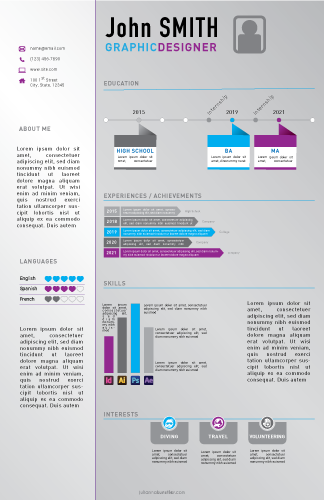
Creative way to set your resume apart from others is to use an infographic layout.
You can combine multiple infographic types to better represent the information.
Design (colors, graphics) should reflect your personality, have a friendly and professional feel, and be appropriate to the goal.


 Step 1: Research the Topic
 Step 2: Data processing
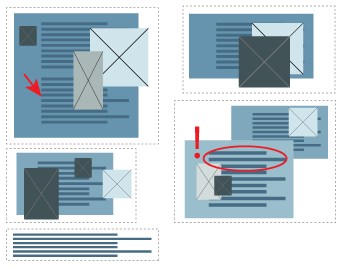
 Step 3: Storyboard
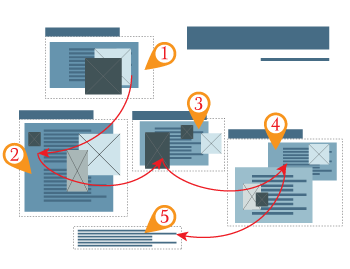
 Step 4: Wireframe
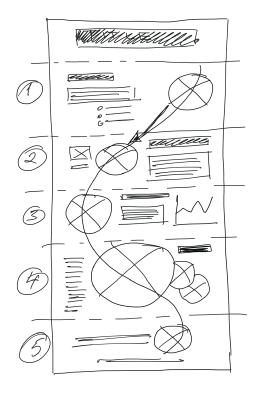
 Step 5: Design Layout
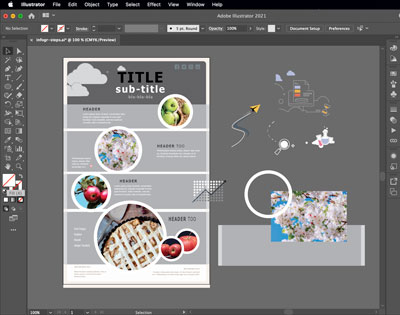
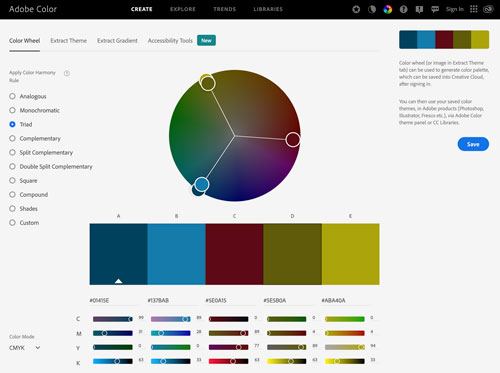
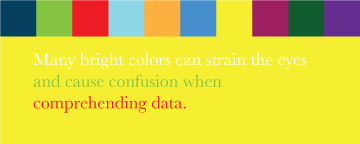
 Step 6: Colors


 Step 6: Graphics
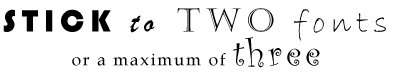
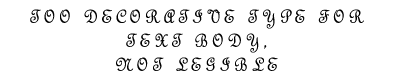
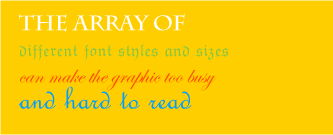
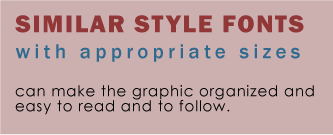
 step 7: Fonts


 Step 9: Finalize
 Step 10: Checklist