julianna kunstler logo
About me

infographic
Instagram icon

by JuliannaKunstler.com

information

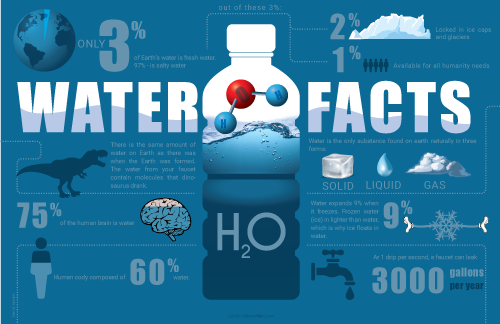
Infographic is a visual representation of data.

It can make dry and boring information exciting!

Humans are visual creatures. It is easier to see "snapshots" of data vs. paragraphs of text.

You can use infographics to represent any information or message.

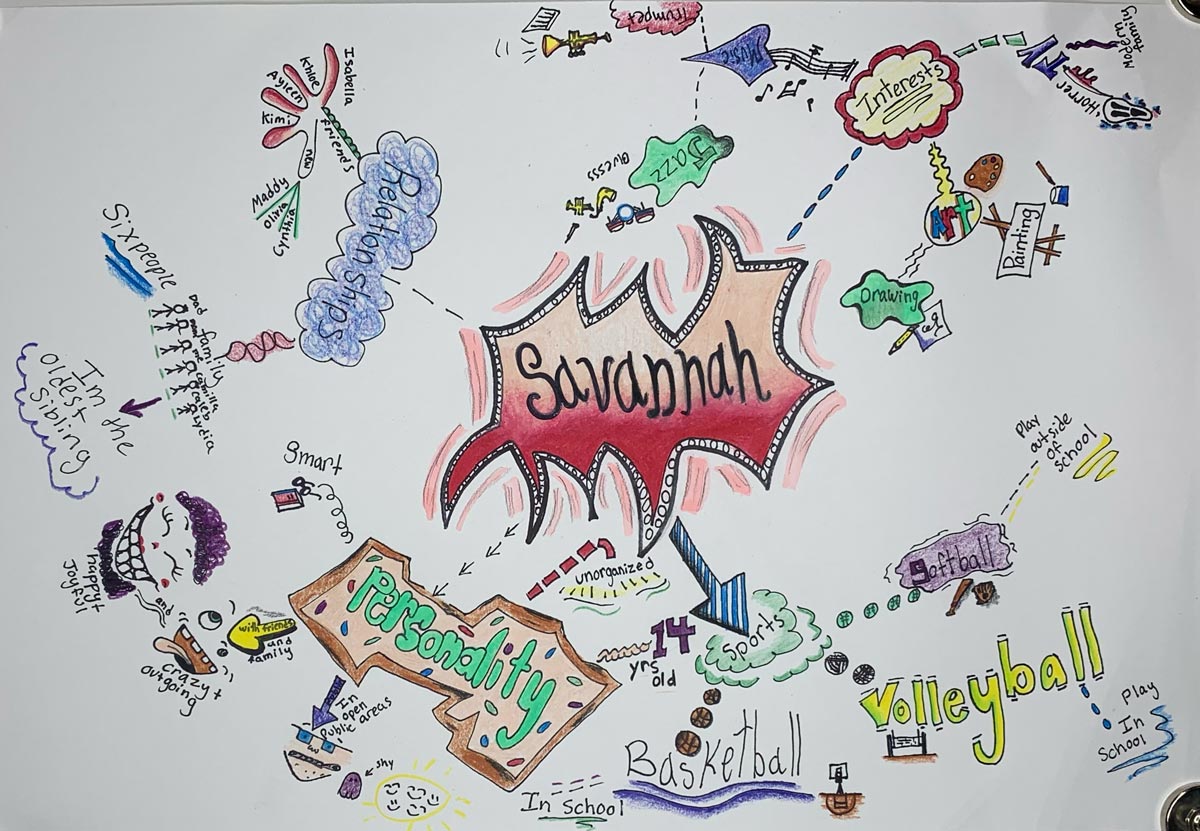
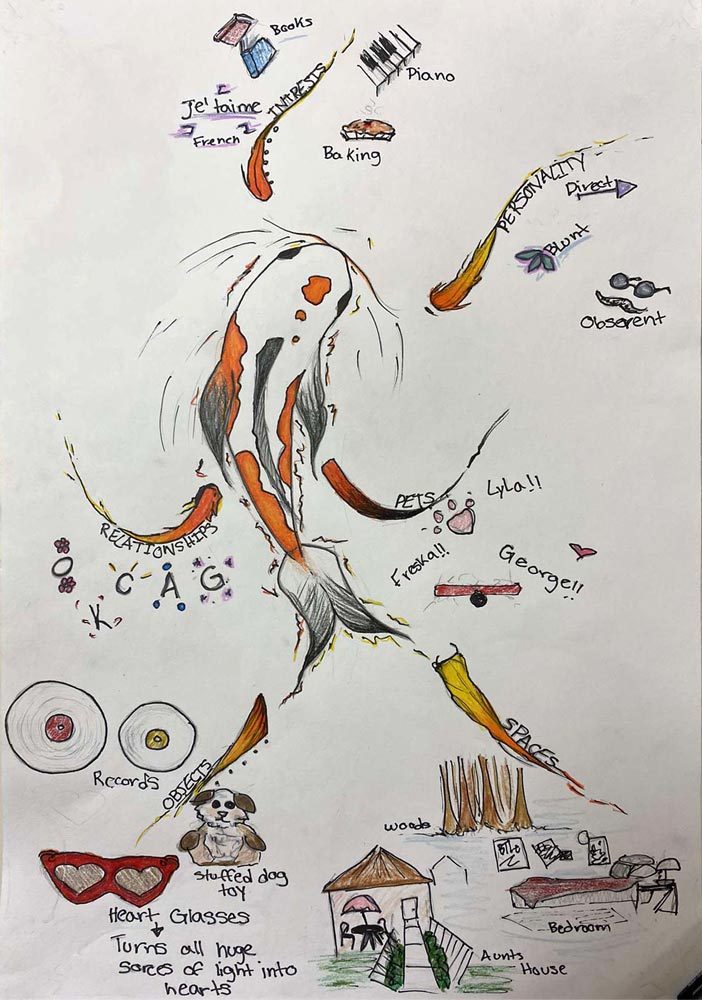
Mind map is a diagram (a form of infographics) that has a branch or root-like structure radiating from a central image on the page, and which uses lines and color to show relationships, groupings and connections betweens words, ideas and images.

GALLERY

STEPS

Create an infographic that will tell me about yourself

Branch out the topics about you that you want to share (write words, references, create images)

Expand as much as you can and add strong amount  detail/creativity

Sketch the layout before you start your drawing.

How to start:

Create one MAIN bubble to represent YOU (it can be an actual bubble, a picture of you, a symbol that will represent you the best)

Create branches to build off topics (anything you want to share: your interests, friends, your goals, experiences, fun facts, favorite books/games, etc.)

Design images and unique shapes

Use keywords or phrases

Start with a pencil

Color with colored pencils and/or markers

Use thin Sharpie for text

.
...